Advanced Excel Assessment
This Advanced Excel Assessment Course is designed for professionals and students who already have a working knowledge of Excel and want to take their skills to the next level. The course focuses on practical, real-world applications that help you analyze data more effectively, automate repetitive tasks, and create powerful reports and dashboards.
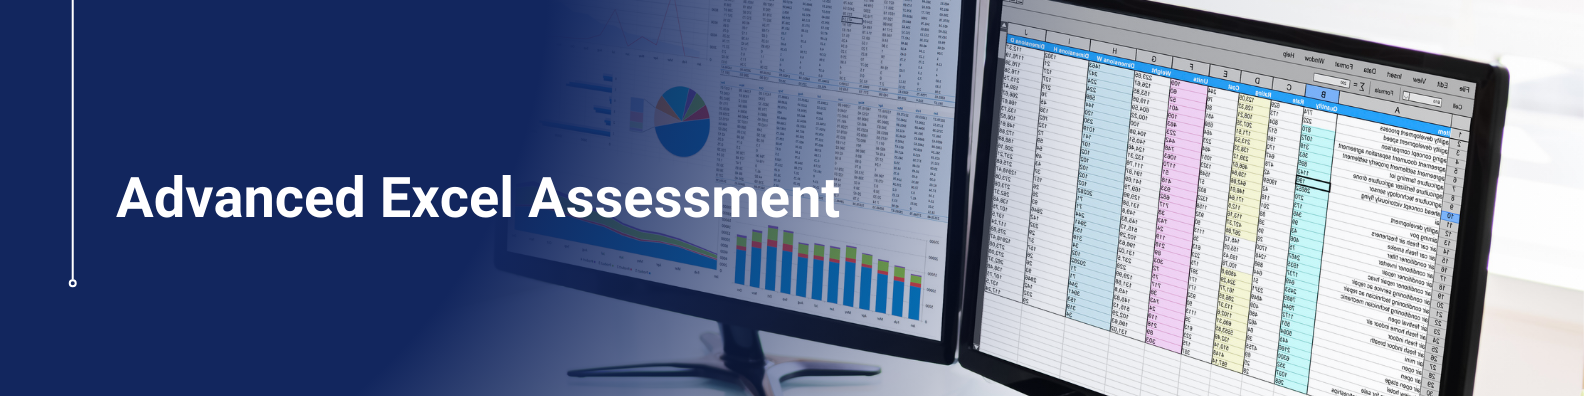
What Is Excel
Microsoft Excel is a spreadsheet program used to organize, calculate, and analyze data in a clear and structured way. It allows users to work with numbers, text, and formulas across rows and columns, making it easier to manage everything from simple lists to complex financial reports. With features like charts, tables, and built-in functions, Excel helps people quickly understand data and make informed decisions. It’s widely used in businesses, schools, and personal projects for budgeting, scheduling, data tracking, and more.
Skills Learnt In This Course
- Use advanced Excel functions like VLOOKUP, INDEX, and MATCH.
- Create and manage PivotTables to analyse data.
- Automate tasks using macros and VBA.
- Design dashboards with charts and slicers.
- Apply conditional formatting to highlight key information.
- Use data validation to control data entry
Who Should Enroll
- Professionals working with large datasets
- Finance and accounting staff
- Data analysts and business analysts
- HR professionals managing employee data
- Marketing professionals tracking campaigns and reports
- Operations and supply chain managers
- Project managers handling schedules and budgets
Skills You Will Acquire by the End of the Course
- Create and manipulate complex formulas
- Automate repetitive tasks
- Apply conditional formatting
- Perform scenario analysis
- Implement data validation
Overview
This assessment is designed to evaluate a learner’s proficiency in advanced Microsoft Excel skills, including data analysis, complex formulas, automation, and visualization. The course prepares individuals to demonstrate their ability to manipulate data efficiently, automate tasks using macros, and present data through dynamic dashboards and charts.
Description
Course Content
Accreditation
- Non-accredited: Short course only
- Duration: 1h 30m
- Delivery: Classroom/Online/Blended
- Access Period: 12 Months
- Master lookup functions: VLOOKUP, HLOOKUP, XLOOKUP
- Learn how to combine INDEX and MATCH for flexible lookups
- Use IF, IFS, AND, OR for logical decision-making
- Work with text and date functions
- Handle errors using IFERROR and ISERROR
- Build PivotTables to summarize large datasets
- Group, filter, and sort data within PivotTables
- Use calculated fields for custom metrics
- Add slicers and timelines for interactivity
- Create PivotCharts for visual representation
- Record and run simple macros
- Understand the VBA editor interface
- Write basic VBA scripts to automate repetitive tasks
- Create buttons and forms for user-friendly tools
- Combine charts, PivotTables, and slicers into dashboards
- Use dynamic ranges for updating visuals
- Link data sources for real-time updates
- Design clean, professional layouts
- Highlight cells based on rules (e.g. top 10 values, duplicates)
- Use color scales, data bars, and icon sets
- Create custom formatting rules with formulas
- Visually track trends and data exceptions
- Create drop-down lists for consistent inputs
- Apply rules to limit entries (e.g. numbers only, date range)
- Use dependent drop-downs (linked lists)
- Prevent errors and maintain data quality
